Over the past few years my home server setup has grown into something that takes genuine effort to keep track of. There is the NAS running on the repurposed HP Compaq, the MediaBox service handling torrent downloads and YouTube channels, Jellyfin serving media to the TVs, a couple of Raspberry Pis acting as remote players, a Pi-hole for DNS filtering, a Telegram bot for notifications, a handful of Tuya smart plugs and lights, and a growing list of my own .NET projects running as systemd services. Each piece worked. None of them were visible in one place.
For a long time I managed everything through SSH sessions, individual service logs, and the occasional Telegram message from my personal assistant bot. That worked well enough when there were three or four things to monitor. It stopped being acceptable when the number of moving parts crossed ten. I needed a dashboard — not a generic one, but one built exactly around the things I actually care about.
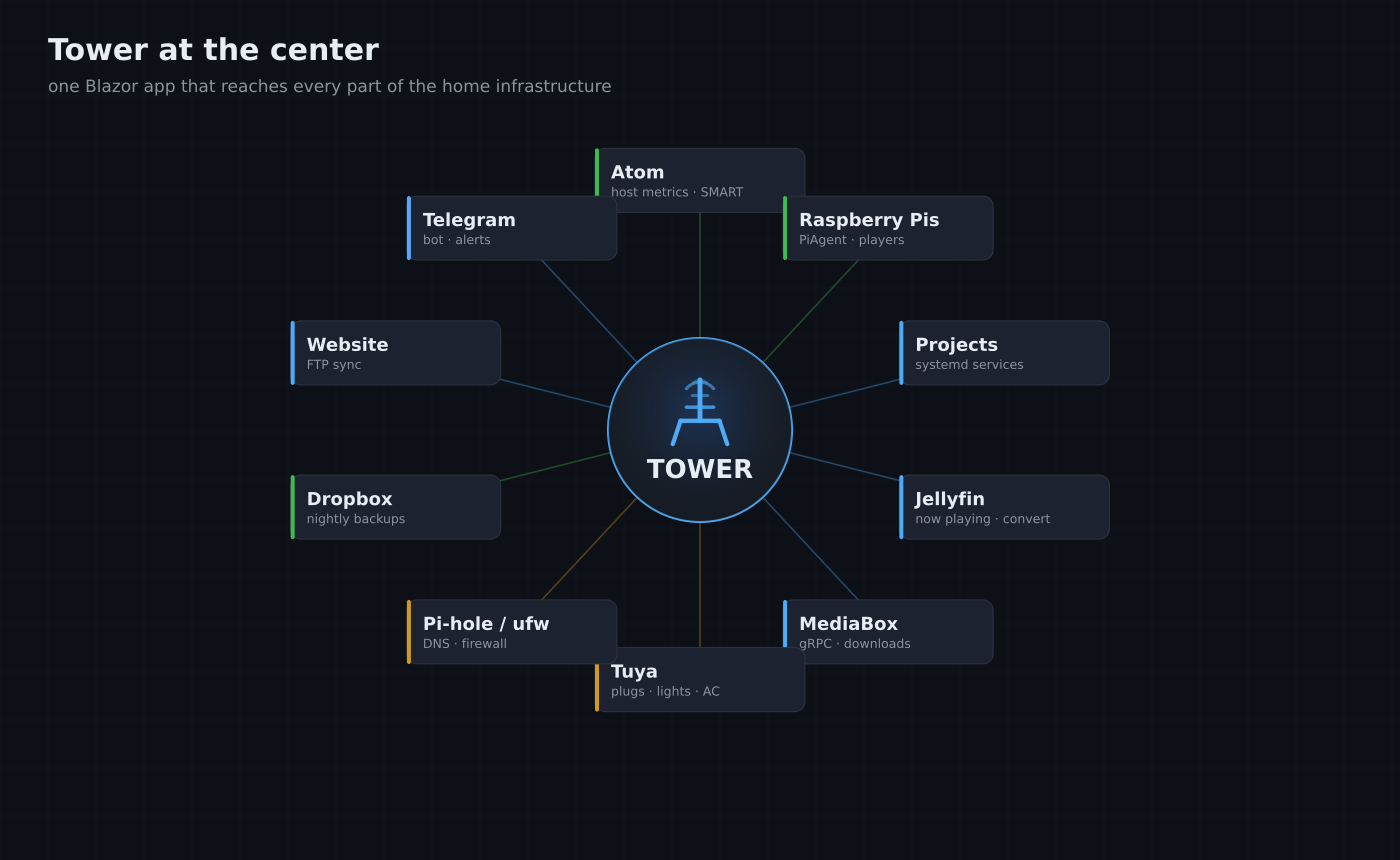
So I built Tower.
What Came Before
Before Tower there was a simpler monitoring script I called server-monitor. It was a JSON config file and a collection of shell checks that fed into a Telegram message on demand. It told me whether services were up and what disk space was left. That was genuinely useful when I first set it up, but it was static — you had to ask it, it couldn't tell you anything in real time, and it certainly couldn't do anything.
I also had the Telegram bot from the Personal Assistant project, which had grown to handle home security alerts, media downloads, and a few commands. But that bot was built to react, not to give me a continuous picture of the system. These were two separate things, and neither was a real dashboard.
What Tower Is
Tower is a Blazor Server web application built on .NET 10. It runs permanently on Atom (my main server) as a systemd service on port 8888, and it pulls together every aspect of my home infrastructure into a single interface. It is not a general-purpose monitoring tool — it is built specifically around my setup, with direct integrations for the exact services and devices I run. Today it is organised into eleven sections down the left rail: Home, Devices, Projects, MediaBox, Communication, PiHole, Firewall, Tuya, Website, Jellyfin, and Settings.
The technology choices here were deliberate. Blazor Server gives me a reactive UI with real-time updates over a WebSocket without needing a separate frontend build pipeline or a JavaScript framework. Since this runs on my LAN only, the latency of round-tripping state through the server is not a concern, and I get to write everything in C#. SQLite handles persistent state through Entity Framework Core. gRPC handles communication with MediaBox and with the Tuya smart-device proxy service.
System Monitoring
The home page gives me a real-time view of Atom's health — CPU percentage with a 60-point rolling sparkline, memory usage, network throughput (both receive and send with their own history graphs), root disk fill percentage, and a SMART health summary for each physical drive. Load averages, CPU frequency, and temperatures from each sensor chip are all visible. The page refreshes on a two-second timer.
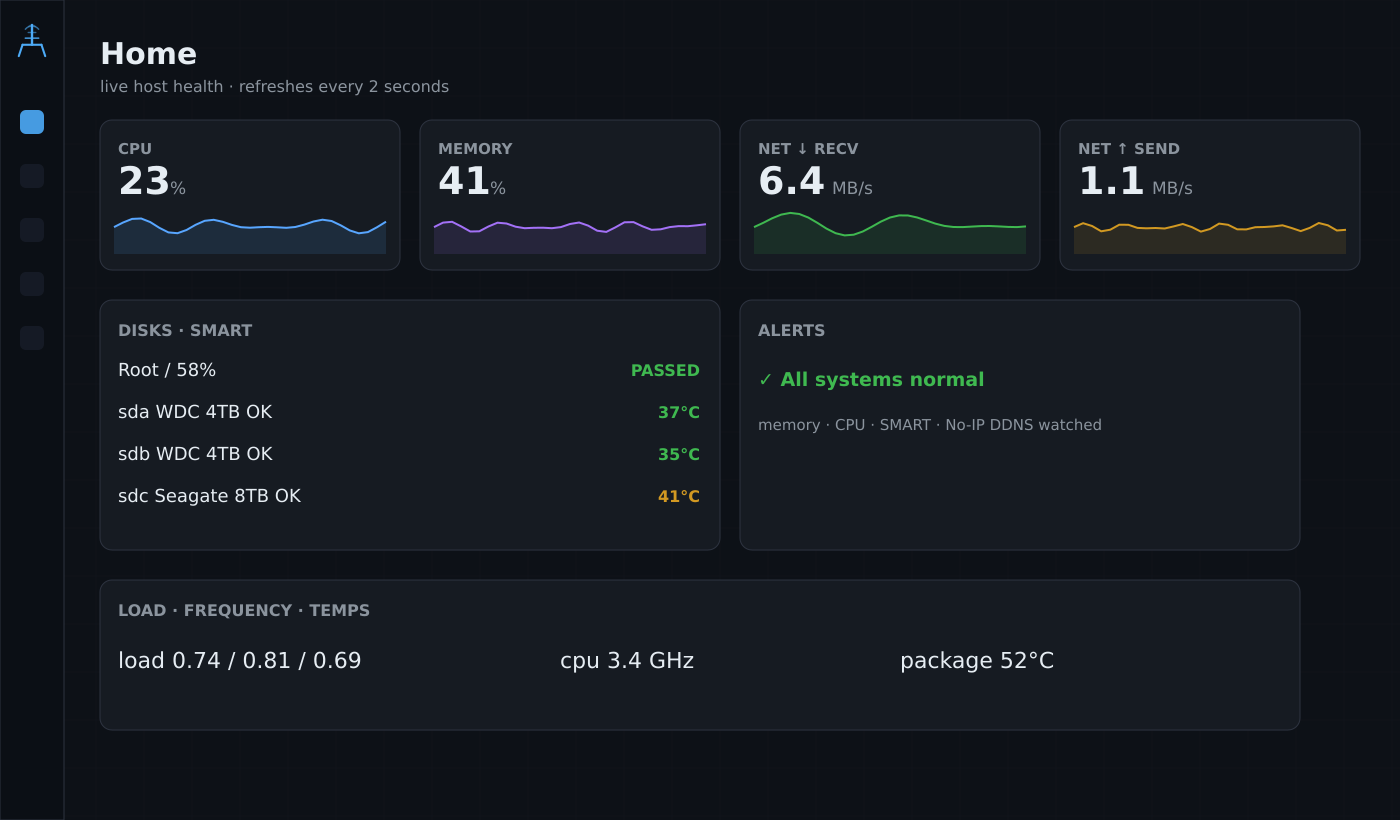
There is an alerts section on the home page that surfaces anything that needs attention: a SMART warning on a disk, memory pressure above 80%, high sustained CPU, or the No-IP DDNS service going silent. No-IP is important because my home connection does not have a static IP, so if the service fails to update my hostname the whole remote access setup breaks quietly. Having that as a first-class alert means I notice it before anything actually stops working.
Device Management
Under the Devices section, Atom and both Raspberry Pis (AtomTV and AtomMiniTV) each have their own panel. For Atom itself this includes a full system view, storage breakdown, maintenance controls, and configuration. The system view also reports the GPU when one is present — Tower reads nvidia-smi for name, utilisation, memory, temperature, and power draw, which I added for the times I run ML inference on the machine. For the Pis, Tower polls a lightweight agent service I run on each one called PiAgent, which exposes the same system stats over HTTP. If a Pi goes offline the dashboard shows it as offline within a few seconds.
The maintenance panel lets me trigger system updates and run a maintenance script directly from the browser without opening an SSH session. This is the kind of thing that sounds trivial but in practice means I actually do routine maintenance instead of putting it off because opening a terminal is one more step.
Project Health
Every .NET project I run as a systemd service — MediaBox, FinanceTracker, the blog editor, NewsDigest — is listed in the Projects section with its current systemd status, whether its port is open, and a live CPU and memory reading from the process. If a service crashes, Tower shows it within seconds. I can restart a service from the UI without touching SSH.
This was one of the most immediately useful additions. Before Tower I would only notice a crashed service when something downstream stopped working — Jellyfin could not reach MediaBox, or a blog edit would fail silently. Now I have an alert on the home page if any project service is not in an active state.
Jellyfin Integration
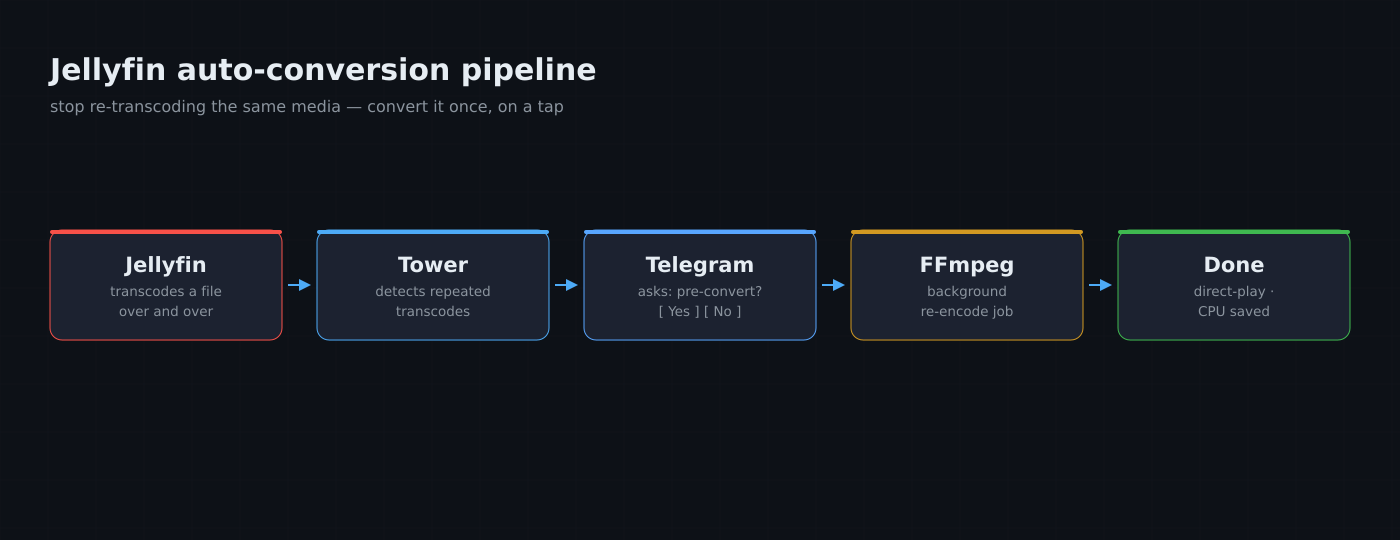
The Jellyfin page shows active playback sessions in real time — who is watching what, on which device, and whether the stream is being direct-played or transcoded. Transcoding gets highlighted because it means FFmpeg is running and consuming CPU on Atom. I keep a rolling 60-point history of FFmpeg process count and CPU usage so I can see if transcoding has been hammering the server across the past hour.
More usefully, Tower has a conversion pipeline that watches for repeated transcoding events. If Jellyfin keeps transcoding the same piece of media, Tower sends me a Telegram message with an inline keyboard asking whether I want to pre-convert the file to a Jellyfin-compatible format. One tap queues the job. The conversion runs in the background using FFmpeg, and Tower sends another message when it is done. This has saved a meaningful amount of unnecessary CPU time on files I keep coming back to.
MediaBox Control
MediaBox is my media orchestration service — it manages torrent downloads via Transmission, RSS feed checking, library organisation, and scheduled YouTube channel archiving. Previously it ran completely independently with its own schedule and its own Telegram interface. Tower now speaks to MediaBox over gRPC and gives me a full control panel: active downloads, the media library, the watchlist, YouTube sources, and all of MediaBox's settings, accessible from one browser tab.
Tower also took over the scheduling of MediaBox's background jobs — RSS checks every 30 minutes, download organising every 10 minutes, Transmission polling every 5 minutes, a full library scan every 12 hours, YouTube checks every hour. This means Tower is now the scheduler and MediaBox is the executor. The reason for this split was to give Tower visibility into what is running and the ability to coordinate jobs without everything being buried inside a separate service's internals.
Smart Home Control
This is the part that ties Tower back to the rest of my home automation work. The Tuya page controls every smart device on my network — plugs, dimmable lights, multi-gang wall switches, an IR blaster acting as an AC remote, and a presence sensor. Tower talks to the devices through a small Python tinytuya service running locally on port 6677, which keeps the messy local-key protocol out of the C# code. Devices are grouped by room, and each one gets a control appropriate to its type: a simple ON/OFF toggle for plugs, a brightness slider for lights, per-channel toggles for the two- and four-gang switches, and a full temperature and mode panel (cool, heat, fan, dry, auto) for the AC.
Adding a device is a scan-and-assign flow. Tower asks the cloud project for the device list, falls back to probing the LAN for anything listening on the Tuya port, and then lets me name each device, pick its type, and assign it to a room before saving. The fiddly part of Tuya is always the local keys — if a device shows up without one, Tower lets me paste the key in directly from the card. It is the first time controlling all of these devices has lived in the same place as everything else I run.
Network — Pi-hole and Firewall
The PiHole page pulls live stats straight from the Pi-hole API: queries today, how many were blocked, the block percentage, unique clients, the size of the gravity blocklist, the top blocked domains, and the upstream DNS servers in use. When I first wrote about Tower this was on my wish list — it is now built, and seeing the block percentage climb during an evening of ad-heavy browsing is oddly satisfying.
The Firewall page reads ufw directly. It shows whether the firewall is active, the default policies for incoming, outgoing and routed traffic, the logging level, and the full rule list — destination port, action (allow, limit or deny), source, and the comment on each rule. IPv6 rules are hidden behind a toggle so the common case stays readable. It is read-only on purpose; I want to see the firewall state at a glance, but I still make changes deliberately from the shell.
Website Sync
Tower also publishes this website. The Website page is an FTP-over-TLS sync tool: it scans my local public_html tree against the live host, compares every file by size and modification time, and shows me three buckets — files to upload (new or changed), files that exist only on the remote (which I can tick to delete), and files that are already up to date. Exclude patterns keep generated directories out of the comparison. Nothing moves until I look at the diff and press Sync, and a live log streams each upload as it happens.
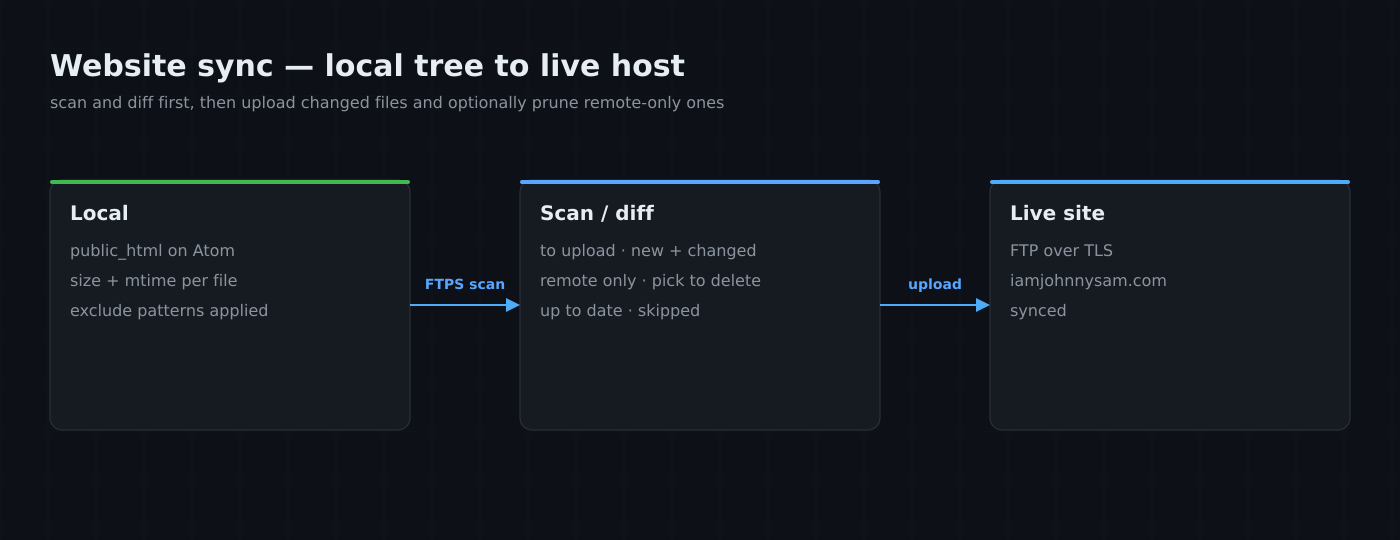
This replaced a separate FTP step I used to run by hand, and it is the same mechanism that pushed the images and HTML for the post you are reading right now to the live server.
Automated Backups
Every night at a configurable time, Tower takes a consistent snapshot of every SQLite database in the ecosystem — MediaBox, FinanceTracker, the blog editor, Tower's own database — and uploads each one to Dropbox under /server-backups/. The SQLite Online Backup API means this is safe even while the databases are actively in use. Results show up on the dashboard so I can verify the backup ran without having to check Dropbox manually.
I lost some data once when a project database got corrupted during a power cut and I had no recent backup. The backup scheduler in Tower is a direct consequence of that.
Telegram and Communication
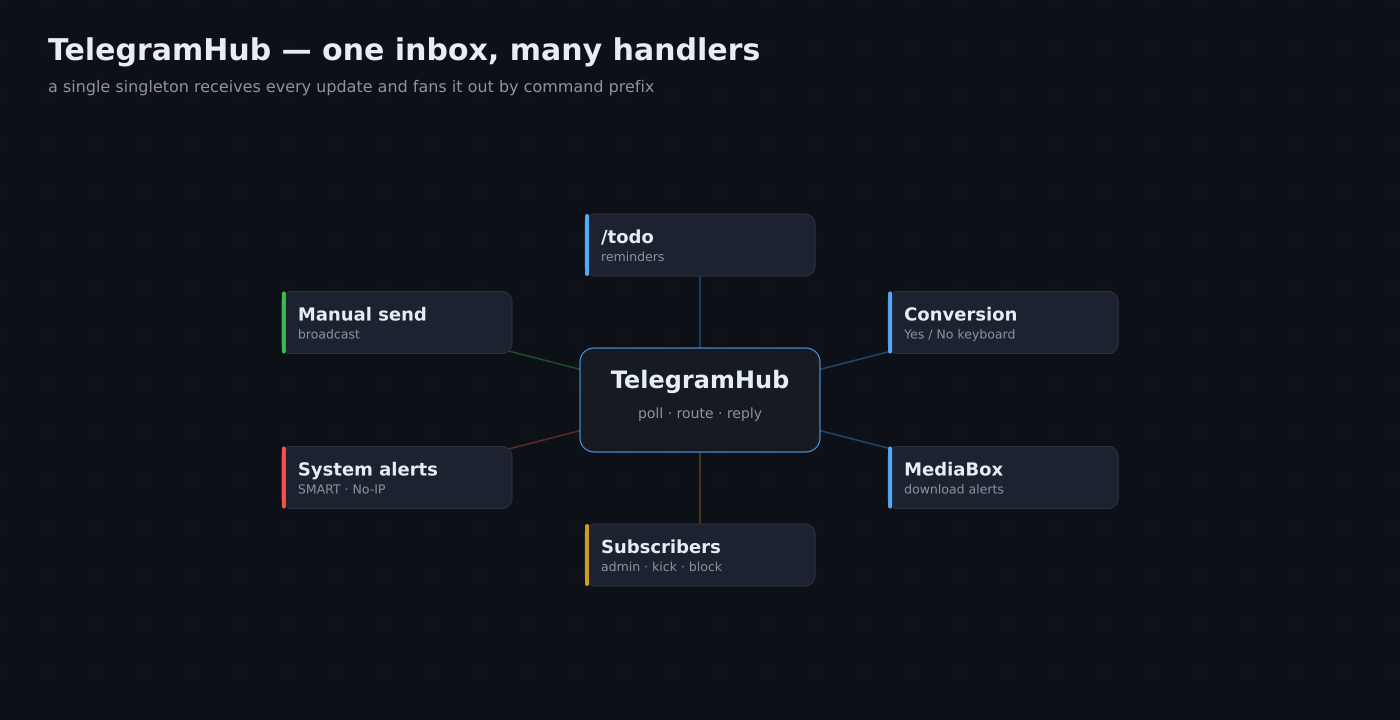
Tower extends the Telegram bot I had been running since the Personal Assistant days. It inherits the subscriber model — the first user to message the bot becomes the admin, everyone else is a standard subscriber. Commands are registered by individual services inside Tower, so the conversion pipeline registers its own callback handlers, the to-do system registers /todo, and MediaBox alerts register their own inline keyboard responses. The architecture is a hub-and-spoke model: a single TelegramHub singleton receives all inbound updates and fans them out to whichever handler claims the prefix.
The Communication page is the front end for all of this. It shows whether the bot token is configured and whether the bot is active, how many gRPC clients are connected, and the last error if anything went wrong. There is a subscriber table where I can kick or block users, a rolling message log showing inbound and outbound messages, and a manual send form to push a message to all subscribers, the admin, or a specific chat ID. The activate toggle carries a deliberate two-click confirmation, because Tower and MediaBox must never poll Telegram at the same time — two pollers on one bot token gives you a 409 conflict, so flipping the bot on is something I want to do on purpose, not by accident.
To-Do List
This one is small but I use it constantly. There is a to-do list on the Tower home page with deadlines, and I can add or complete items either from the browser or by sending a Telegram message. The reminder worker checks for items approaching their deadlines and sends a Telegram notification. It is simpler than any task management app I have tried and it is always open because Tower is always open on my second monitor.
What Is Running Now
Tower has been running in production since early 2026 and has been stable. Two things from my original wish list have since landed — GPU monitoring on the Atom system view, and the full Pi-hole stats page. What I still want to add is a proper log viewer so I can read project service logs from the browser instead of falling back to journalctl over SSH, and write access on the Firewall page so I can add or remove a ufw rule without leaving the dashboard.
The source is private for now since it contains a fair bit of personal infrastructure wiring, but I will likely clean it up and open it once it is more generalised.